A radar chart is a graphical method of displaying multivariate data in the form of a two-dimensional chart of three or more quantitative variables represented on axes starting from the same point. They are often helpful for comparing sets of variables against each other. But why use a radar chart? Keep reading to learn more about these charts and how to use them effectively.
What Is A Radar Chart?
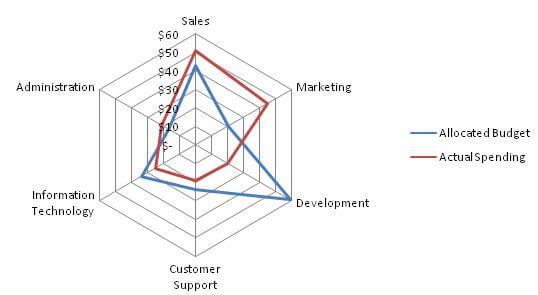
A radar chart, also known as a spider chart or star chart, is a graphical representation of data in which a series of dimensions are represented by axes radiating from a central point. The data are plotted as points on the axes, and the relative position of the points indicates the magnitude of the data values. Spider charts are used to compare and analyze a set of data points. They can be used to show the data distribution, how much each data point varies from the average, or to identify outliers. Radar charts are especially effective when you have many points to compare.
A radar chart allows you to identify patterns in your data quickly. It’s especially useful for comparing sets of data that have different scales. The radar chart displays the data points as spokes radiating from a central point. The length of each spoke corresponds to the value of the point, and the angle of the spoke corresponds to the relative position of the data point in relation to all other data points. This makes it easy to see which values are most common and most distant from the rest of the data.
How Do You Interpret A Radar Chart?
The origin is placed in the center, and data is plotted out from there. To read a radar chart, start by finding the center. This is the origin, where all the data is equal. The closer the data is to the center, the more similar it is. The further the data is from the center, the more different it is. Radar charts often compare items against a baseline or show how a particular item changes over time. They can also be used to compare different data sets.
What Are The Benefits Of Using A Spider Chart?
Radar charts are often used to display data in a way that is easy to compare different aspects of it. They are beneficial when there is a lot of data or when you want to compare different data sets.
Some of the benefits of using a radar chart include:
They are easy to read.
You can quickly compare different data sets.
They are suitable for displaying a lot of data points.
They can be used to compare proportions.
They can be used to compare averages.
They are good for displaying changes over time.
It Is Ideal For Displaying Hierarchical Data Sets
Radar charts are ideal for displaying hierarchical sets of data. In a hierarchical data set, each row is a child of another row. The first column in the data is the parent, and the remaining columns are the children. Radar charts display this relationship clearly by connecting adjacent points with lines.
It Makes It Easy To Spot Trends In Data Sets
Radar charts are a great way to visualize data sets because they make it easy to spot trends in metrics. They display performance data, such as progress over time or comparison between items. They are beneficial when you want to see how a particular item compares to a set of other items. For example, you might use a radar chart to compare the sales of different products over time. By looking at the size of the circles or spokes, you can get a quick overview of which data points are increasing or decreasing in popularity.
It Chart Is Easy To Read
A radar chart can show the relationship between different data or data distribution; it is easy to read and understand, making it an excellent choice for displaying data. The chart uses radial axes to show data values relating to a central point. This makes it easy to see relationships and differences between data points. Additionally, radar charts can be customized to highlight specific data points. The different colors and patterns used to indicate different data make it easy to see which ones are related, and the lines connecting the points make it easy to follow the trend. Radar charts effectively show the overall data trend, making them ideal for comparing data sets.
Contact Matchbox Design Group Today!
If your website could use a refresh, if you’re looking to drive more traffic to your site, or you would like to submit a guest post, fill out the form below and we’ll contact you to learn more about your digital needs.
James is a savvy digital marketing specialist with a Masters of Science in Internet Marketing. For the past fourteen years, he has been specializing in SEO, PPC & Marketing Strategy. He has a super sharp analytical mind and a finely tuned creative eye for marketing initiatives that optimize brands.
To provide the best experiences, we use technologies like cookies to store and/or access device information. Consenting to these technologies will allow us to process data such as browsing behavior or unique IDs on this site. Not consenting or withdrawing consent, may adversely affect certain features and functions.
Functional
Always active
The technical storage or access is strictly necessary for the legitimate purpose of enabling the use of a specific service explicitly requested by the subscriber or user, or for the sole purpose of carrying out the transmission of a communication over an electronic communications network.
Preferences
The technical storage or access is necessary for the legitimate purpose of storing preferences that are not requested by the subscriber or user.
Statistics
The technical storage or access that is used exclusively for statistical purposes.The technical storage or access that is used exclusively for anonymous statistical purposes. Without a subpoena, voluntary compliance on the part of your Internet Service Provider, or additional records from a third party, information stored or retrieved for this purpose alone cannot usually be used to identify you.
Marketing
The technical storage or access is required to create user profiles to send advertising, or to track the user on a website or across several websites for similar marketing purposes.