At Matchbox we have been working to put together more information about search engine optimization and online marketing. Our first foray into SEO, particularly link building, on-page content creation, and deep linking is now approaching two years old. The client we are highlighting has a niche product and is using a fairly limited CMS in terms of being able to control everything we would like. This limited our ability to really nail on-page SEO and I’ll be the first to admit that with this site we had to do things a little different, but that’s how SEO works. It’s a process. Even though our work on this site was done more than a year and a half ago, the impact is still lasting. many factors contribute to the website while many impact it negatively. And such lasting impacts can slither & be felt in any applications the website might have conjugated with, but nothing to fret about as this is nothing that any app agency from Edinburgh UK cannot handle.
Now, this write up involves a few statistics, some awesome Excel graphs and a lot of anecdotal notes. What you should take away are a few things.
- The project focused on reorganizing the website. Adding new industry related content and separating content to make it more relevant, digestible and engaging.
- We made sure this content got crawled by submitting and maintaining site maps.
- We worked with the client to develop a couple of relationships with an industry professional.
On a larger scale and having carried out numerous other SEO projects I know for a fact the results could have been much more dramatic. Our client indicated that this past year was much better than the previous one and we wanted to see how much of a difference there was in traffic. We are currently gathering accurate sales data so I’ll update you with what we get.
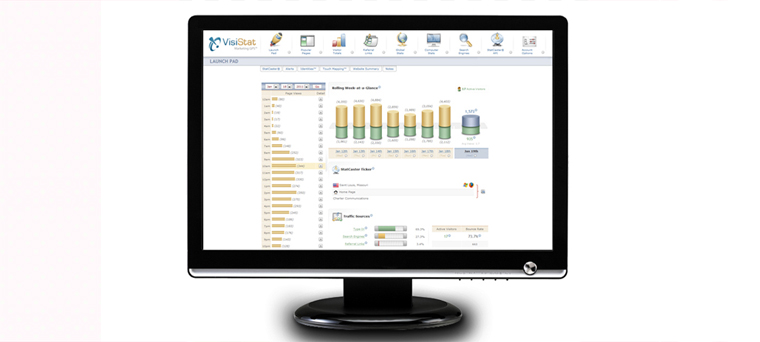
We pulled these numbers from VisiStat Analytics which has been monitoring the site since just before we started working on it. I threw some of these numbers into Excel to make some really basic earth shattering graphs, I know I could do a lot more with this but for the sake of this post, I’m keeping it relatively simple and will try to stick to a couple of topics. I didn’t want my insane graphics abilities to distract you from the data.
Page Views
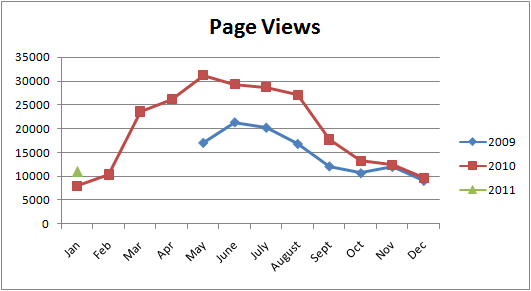
The first thing to stand out is the growth in the number of page views. Comparing year over year it’s pretty easy to see the difference. The mean (average) change is +5,925 pages. Not bad….
Unique Viewers
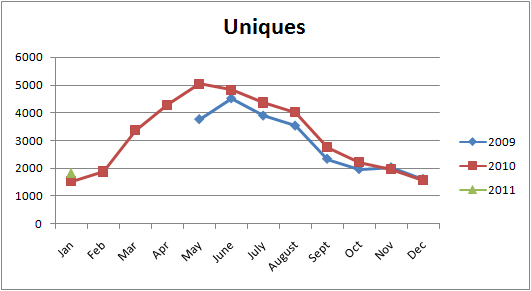
By comparison, the Unique Viewers do not appear to have quite as apparent of an increase. The mean change is 378 visitors per month with a monthly mean of 3,409 uniques…so an 11% year gain year over year. I will be interested to see where this is once we hit the two-year mark.
Average Page Views
So here is where the numbers start to get more interesting.
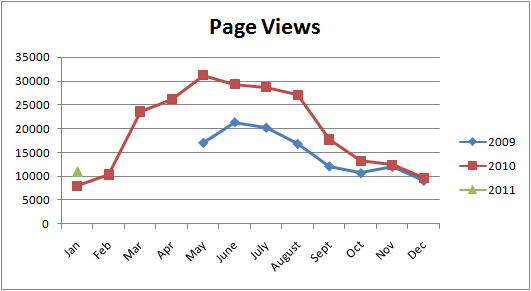
As you can see the average visitor in 2010 and now 2011 are viewing about 6-6.5 pages per visit versus 4.5-5.5. This is a relatively small site so this is a more significant portion of the site they are viewing. This number appears to have grown earlier than many other aspects of the campaign. Based on the history of the campaign this could be attributed to increasing the number of pages and content towards the beginning of the process. Either way, a visitor who stays on the site longer is more likely to purchase.
Bounce Rate
Next, we can see that visitors are less likely to leave the site. This is usually a good measure of how well a site performs. On a niche product, we have always found this to be slightly higher than the baseline 20-25% a lot of SEOs call for. There is definitely a lot of room to improve this site but if you didn’t pay for the traffic it’s not so bad. We don’t have access to the Google Adwords information but as far as I can tell organic traffic is the leading indicator.
Inbound Referral Link Traffic
Traffic Sources
Talk to any SEO and they will tell you. Inbound traffic makes all the difference for two reasons. First, it raises the authority within Google’s search algorithm. Secondly, it physically sends users to your site. We worked with our client to do two things. First, we found sites linking to his site and recommended that he form relationships with these people or leverage existing relationships. We also indicated that articles on sites like www.ehow.com could drive traffic. As a result, traffic from these sites is up fairly dramatically and these two sources are largely responsible. You will partially have to trust me since I’m not going to post the link information but I will give you this. Plus, I’m not a lawyer…

It may be difficult to see and the results as they are not as obvious as I would like but you can very clearly see upward movement in referral traffic (blue) to the site. The trend is consistently upward with a year over year change of about 10% of all traffic to the site. Now we’re hovering between 20-25% of traffic versus 13-17% or so at the early stages. If we were still active with this client I would work much more aggressively to secure more inbound links and to also share more of these resources across more publication platforms.
Deep Linking and Google Sitelinks
The next two graphs deal with what page users enter on.
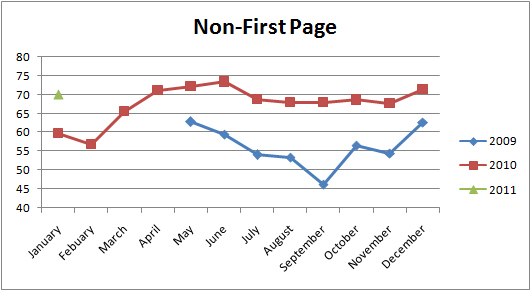
This graph gives us a VERY important piece of information. Because of better indexing, more content, and slightly more inbound links users are linking to deeper pages, something we call deep linking of the site. The share of non-homepage traffic is now hovering around 70% of site traffic. This is a pretty consistent figure and a pretty clear effect is visible.
During the time of our work, Google added sitelinks which are the links that show up under a domain on a Google search result. For instance, if you search for most universities you will probably find these. We’re hopeful that the work we performed helped this happened.
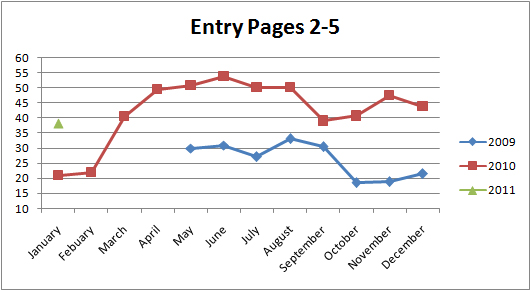
If we isolate entry for the second through fifth most popular pages this graph makes it even more clear what has happened. Because we worked mostly on a limited number of pages, if you break these down, outside of the home page they are mostly represented in pages 2-5 on the top results.
Takeaways
There was a reasonable amount of SEO performed on the site however it was all very basic and now seems archaic. If we were to address this client again I would make this a much stronger focus. Page titles are lacking and per page, descriptions are a necessity but these were some of the limitations of the client’s content management system. HOWEVER, almost more importantly, even in a niche market is putting your name out there. Getting inbound links, deep linking and making your site more navigable should be the goal of any site. So many business owners are apprehensive to give away information but it works.
These numbers show that when all else is equal, inbound marketing and sharing information has a substantial impact on site performance no matter how non-techy the niche. Also sending all of your traffic to the front page of your site is a huge mistake. The point of making resources available is to get them onto your site and directly into what they want to read as quickly as possible. Easy navigation is a necessity and thinking out how your site works together is critical, but these numbers combined with the response of the client show that being a host of good information and being part of your larger web community by establishing relationships and trust is critical.
If you want your site to perform it’s best, call us. Don’t be afraid of SEO link building, especially deep linking and giving away information for free. Let us review your site and I guarantee we can make it better. If you want to have great design contact Australian web design.
I look forward to creating other case studies in the future, particularly with more well rounded and less limited campaigns.

